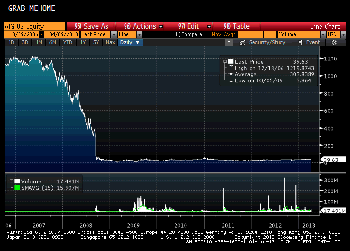
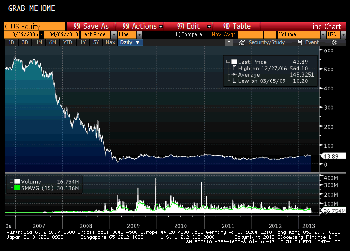
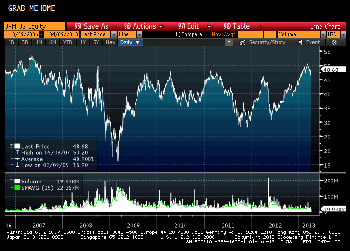
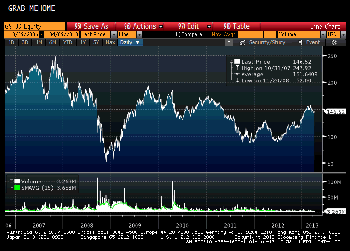
Here we see how the shareholders of AIG, Bank of
America, Citibank and Morgan Stanley did. As the charts
show, the shareholders lost at least 80% of their value. The
widespread perception that the investors were completely shielded
from the consequences of the risks they were taking is not borne
out by these charts:
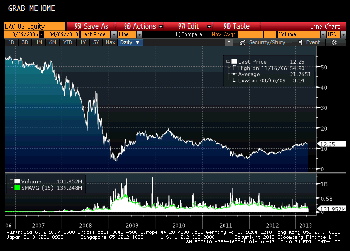
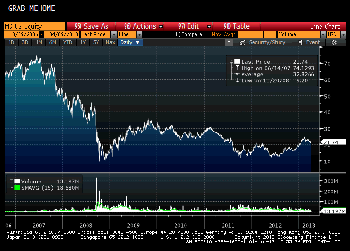
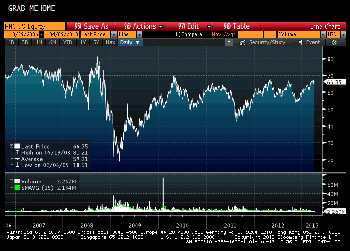
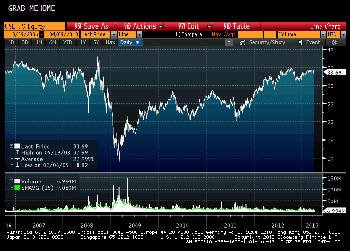
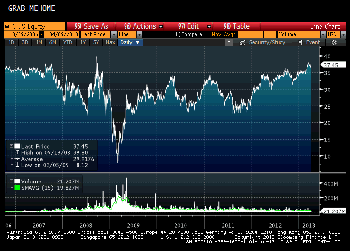
For these other five organizations, we see that
while the stock has recovered somewhat (though not entirely at
Goldman), stock price has not surpassed 2007 levels. The
geometric average increase in the price of any stock in the
S&P 500 is 7% per annum. However, the returns from
2007-2013 for the stock market in general has been flat -- so
these five financial organizations are neither falling behind
nor outperforming the rest of the stock market.